Sidereus Nuncius
Galileo's First Jupiter Observations
Sidereus Nuncius, published in 1610, is Galileo's account of his first astronomical observations using a telescope. He found that the surface of the Moon, like Earth, is rough and uneven, that the Milky Way and several nebulas are made up of numerous stars too faint to see individually with the naked eye, and most famously, that Jupiter has four large satellites.
Over the eight weeks from January 7 to March 2, 1610, Galileo sketched 64 observations of the positions of these four moons relative to Jupiter. The following pages reproduce all 64 sketches, along with a modern calculation of the moons' positions and some brief commentary. Look for the first night that Galileo realized the moons weren't stars, the night he first saw four moons, not just three, and the only night he drew a moon that wasn't there.
What I Did
 I relied on the English translation of Sidereus Nuncius by
Albert Van Helden as well as an edition in the original Latin available online.
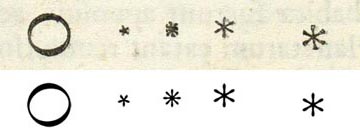
I've redrawn each of Galileo's figures, being careful to preserve both position
and relative scale.
I relied on the English translation of Sidereus Nuncius by
Albert Van Helden as well as an edition in the original Latin available online.
I've redrawn each of Galileo's figures, being careful to preserve both position
and relative scale.
I wrote a program to produce the modern diagrams using the methods described in chapter 44 of Jean Meeus's Astronomical Algorithms, second edition. The method was extended to provide shadow positions in the manner of Sky and Telescope's online Jupiter calculator. In order of increasing distance from Jupiter, the color-coded moons are Io, Europa, Ganymede, and Callisto.
Each Galileo sketch was scaled to provide a good fit to the positions of the moons. Galileo had not yet devised a method of rigorously measuring what he saw, and the optics of his 1610 instrument wouldn't have allowed it in any case, so his sketches are qualitative, and the scale of the drawings here will vary significantly.
All of the times in the figures are UT. Galileo reported the times of his observations as a number of hours, and sometimes minutes, after sunset. The times in the figures are derived from my calculation of the time of sunset in Padua using the method described by Paul Schlyter.
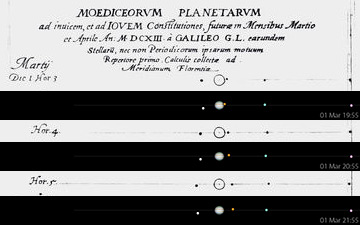 By
1613, Galileo's optics and his methods for measuring and recording the motions
of Jupiter's moons had improved dramatically. The figure on the left compares
Galileo's record with my drawings for the third, fourth, and fifth hour past
sunset on March 1, 1613. The rapid motion of Io in particular is a good test
of the accuracy of the modern calculations and the assumptions about Galileo's
dates and times.
By
1613, Galileo's optics and his methods for measuring and recording the motions
of Jupiter's moons had improved dramatically. The figure on the left compares
Galileo's record with my drawings for the third, fourth, and fifth hour past
sunset on March 1, 1613. The rapid motion of Io in particular is a good test
of the accuracy of the modern calculations and the assumptions about Galileo's
dates and times.
Has This Been Done Before?
Yes, to varying degrees.
Jean Meeus was probably the first to perform a modern calculation of the
positions of the moons, compare it to Galileo's 1610 observations, and present
the results in graphical form (Galileo's First Records of Jupiter's
Satellites,
Sky and Telescope, Feb. 1964, pp. 105-106).
According to Meeus, it had been widely assumed that the three moons Galileo saw
in the first week were Io, Europa, and Ganymede (I, II, III) and that the one he
missed prior to January 13 was Callisto (IV). That's clearly
not right, as Meeus showed.
Meeus himself drew the graphic in this article by hand. It shows only the first eight observations, and for the modern calculations, it depicts only the longitudes, omitting the small excursions in latitude. This is a clue that the calculations were also done by hand, based on tables Meeus published two years earlier (J. British Astro. Assoc. 72:80, 1962).
Stillman Drake, in an appendix to his 1983 book Telescopes, Tides, and
Tactics: A Galilean Dialogue About the Starry Messenger and Systems of the
World, gives a table of elongations for 75 observations, which includes
10 observations Galileo described but didn't sketch. Drake notes the unidentified
dot on Galileo's entry for February 12, calling it a mistakenly reported star
no longer seen.
No graphics, though, and no details about how the modern
calculations were done.
Planetarium software can now provide the calculations and the graphics. An
example is Barbara Becker's use of Redshift in her online
lecture notes. She's also acknowledged for this use of the program to
verify Galileo's observations in Owen Gingerich and Albert van Helden, From Occhiale to
Printed Page: The Making of Galileo's Sidereus Nuncius,
Journal
for the History of Astronomy vol. 34 (2003), pp. 251-67.
As far as I know, the first publication of modern diagrams for all of
Galileo's Jupiter observations is Franco A. Levi and G.R. Levi-Donati, Il
cielo di Galileo: una verifica delle osservazioni descritte nel Sidereus
Nuncius
[The sky of Galileo: a review of the observations described in the
Starry Messenger], Quaderni di storia della fisica vol. 1 (1997),
pp. 39-54. They used several programs (Planet 4.0, Voyager 1.0, Microprojects
Astro 1.3 and 1.4, StarryNight Mac 1.0.1) but don't say which of them was
used for the Jupiter figures.
Levi and Levi-Donati, like Drake, note the non-existent moon drawn on February 12. They remark that Galileo was traveling from Venice to Padua that day, the implication being that he observed under unfamiliar circumstances, or maybe drew the sketch some time later, from memory. They generally make the same assumptions I do about observations for which Galileo fails to indicate a time. They cite a biography of Galileo by Drake, but not his 1983 work containing the table of Jupiter observations.
Oddly, about half the modern, computer-generated drawings of Jupiter's moons in Levi and Levi-Donati are upside-down (mirrored vertically)! I can think of a number of causes, including the notorious TIFF orientation flag and the fact that Windows BMP stores rasters in bottom-up order, but I don't know why this would affect only half of the images. Since they don't say specifically which software they used, we don't know whether it was a contributing factor.
A paper by Enrico Bernieri, Learning
from Galileo's Errors,
J. British Astro. Assoc. 122:3, 2012
pp. 169-172, cites the Web page you're now reading, so we've come full circle.
Bernieri used The Sky version 6 to calculate the satellite
circumstances. He analyzed the angular separations between the satellites to
arrive at conclusions about the accuracy and resolution limits of Galileo's
observations.
After seeing his paper mentioned here, Enrico very kindly wrote to me to say that these pages were among the things that had stimulated his work on the paper. I am indebted to him for making it possible for me to read Levi and Levi-Donati.
© Ernie Wright
Last modified 9 February 2013
