Milky Way
Visualization of Star Catalogs
From Earth, the galaxy we live in is visible as a faint band of light that spans the entire night sky. We're seeing the galactic disk edge-on, from the inside.
The first person to see for himself that this lacteo circulo, or Milky Way, was in fact an ocean of faint stars was Galileo, who reported his Milky Way observations in Sidereus Nuncius.
What was observed by us ... is the nature or matter of the Milky Way itself, which, with the aid of the spyglass, may be observed so well that all the disputes that for so many generations have vexed philosophers are destroyed by visible certainty, and we are liberated from wordy arguments. For the Galaxy is nothing else than a congeries of innumerable stars distributed in clusters. To whatever region of it you direct your spyglass, an immense number of stars immediately offer themselves to view, of which very many appear rather large and very conspicuous but the multitude of small ones is truly unfathomable.
When the Hubble Guide Star Catalog version 1.1 became available in consumer star charting software in the mid-1990s, I wondered whether it could be used to create a simulated view of the Milky Way. But I found what some people already knew about GSC 1.1, that it contained rather severe artifacts.
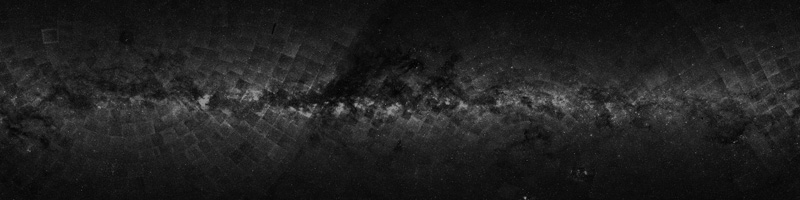
I made the first version of this image in 1996. Brian Skiff of Lowell observatory saw it in November of 1997 and suggested that I post it to sci.astro.research. Astronomer Jessica Mink made similar all-sky images from GSC 1.1 in 1994. The full text of her paper describing this is available online.
I also tried this with the Tycho catalog and, a few years later, with Tycho-2.
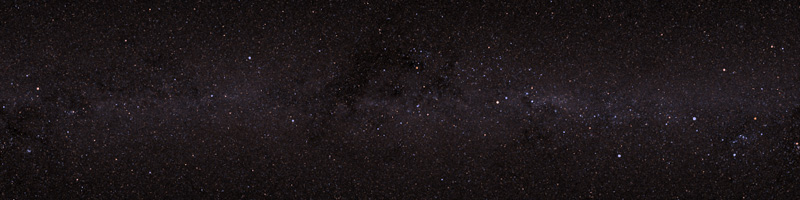
The Tycho catalog has fewer stars than the GSC, so it doesn't show the Milky Way as distinctly. But it's free of the GSC's artifacts, and it includes enough information to draw the stars in color.
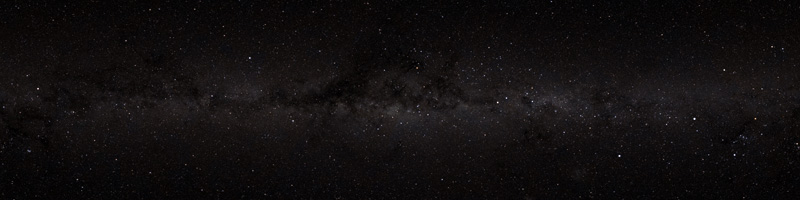
In 2011, as part of my day job, I created an all-sky image using the 100 million stars in the UCAC3 catalog. UCAC3 is deep enough to clearly show the Large and Small Magellanic clouds and star clusters like Omega Centauri and most of the stellar Messier objects.
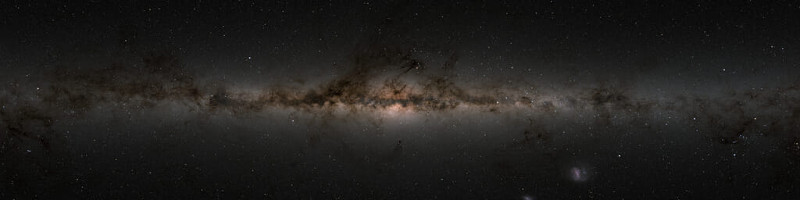
The image at the top of the page is my most recent, created in 2020 while working from home during the coronavirus pandemic. It combines the Hipparcos-2 and Tycho-2 catalogs (for the brighter stars down to magnitude 11.5) with the 1.8 billion stars in Gaia Data Release 2. High dynamic range versions of this image, at resolutions up to 65536 × 32768, are available here.
This sequence of Milky Way images illustrates the rapid evolution of
astrometry and star
mapping over the last 30 years or so. For more historical context, see Michael
Perryman's The History of
Astrometry.
Additional examples of star rendering are on my Star Plots page.
